
Determinants of Customer Experience in Artificial Intelligence-based Social Media Content Creation Tools: An Empirical Study
Surjadeep Dutta1*  , Paul Arun Kumar James1 , Prabhavathy Raja Ebenezer1 and Sarthak Sengupta2
1Faculty of Management, SRM Institute of Science and Technology, Kattankulathur, Chengalpattu District, Tamil Nadu India .
2School of Digital Health, IIHMR University, Jaipur, Rajasthan India .
http://dx.doi.org/10.12944/JBSFM.07.01.04
The practice of digital marketing is being transformed as Artificial Intelligence (AI) grows increasingly dependent on itself for the creation of content on social media. This empirical study investigates the factors that affect customer experience while using AI-based tools for writing content in social media platforms.This specific study is based on purposive sampling methodology. Out of 310 responses obtained, 287 were utilised for the data analysis (removing incomplete responses, detecting and excluding outliers, and conducting reliability checks). The target population considered for this study is Digital marketers, social media influencers, content creators, and those business owners using AI-generated content. The Questionnaire was prepared using Google form and Likert scale questions were prepared. The data was collected and transferred to IBM SPSS & PLS-SEM for analysis. The Samples received from the respondents are transferred to IBM SPSS software for futher analysis followed by Demographic Analysis, Factor Analysis, Reliability Test, SEM Analysis. The findings noted that user's perceptions depend on the quality of the content, as the well-structured, engaging, and grammatically accurate content leads to satisfaction. Another determinant is relevance as users associate interest in AI-generated content, which becomes a lot more relevant with current trends on social media. Customer trust in the AI-based writing instruments depends on the authenticity they put across to users, ethical queries, and handling human-like writing quality. Finally, Brand Visibility is significantly influenced by the effectiveness of AI-generated content in increasing user engagement and organic reach.The study outlines challenges faced by users in terms of originality, personalization, and dependency on AI-generated content. However, despite these challenges, most respondents show a positive attitude towards these AI-powered content writing tools if they remain high in quality, relevance, and credibility.
Copy the following to cite this article:
Dutta S, James P. A. K, Ebenezer P. R, Sengupta S. "Determinants of Customer Experience in Artificial Intelligence-based Social Media Content Creation Tools: An Empirical Study". Journal of Business Strategy Finance and Management, 7(1).
DOI:http://dx.doi.org/10.12944/JBSFM.07.01.04Copy the following to cite this URL:
Dutta S, James P. A. K, Ebenezer P. R, Sengupta S. "Determinants of Customer Experience in Artificial Intelligence-based Social Media Content Creation Tools: An Empirical Study". Journal of Business Strategy Finance and Management, 7(1). Available here: https://bit.ly/45mU5gY
Download article (pdf) Citation Manager Publish History


Introduction
The tremendous acceptance of social media marketing (SMM) and its application in digital marketing enables marketers to reach the customers, create brand awareness, and sell products via the social networking platforms (Kaplan & Haenlein, 2010). In 2023, after a very rapid growth to about 4.9 billion users across the globe, social media platform provides unique opportunities for businesses to promote their services and products among targeted audiences via content marketing, influencers, and paid ads (Statista, 2023). In the academic literature, the social presence has been emphasized to guide consumer behavior development, brand loyalty cultivation, and purchase decision influence (Mangold & Faulds, 2009). The SMM represents a transformational approach to traditional marketing. As opposed to traditional marketing media that depend on one-sided communication, social media enable two-way relationships with customers through business engagement (Tuten & Solomon, 2017). Marketers use platforms like Facebook, Instagram, Twitter, LinkedIn, and TikTok to create personalized and interactive campaigns that have proven highly engaging (Dwivedi et al., 2020). Studies state that social media marketing increases brand awareness, with 90% of marketers affirming it has significantly boosted their profiles (Stelzner, 2021). The costs of advertising on social media are also cheaper than with conventional media. Felix et al. (2017) mentioned that businesses can enhance their advertising efficiency by resorting to social media strategies, able to select specific types of demographic, interest, and behavior. These paid placements such as Facebook Ads and Instagram Sponsored Posts also show how social media uses its relevant algorithms to actively show the right content to the right audience (Ashley & Tuten, 2015). Targeting with precision has thus fundamentally changed the way social media marketing can be classified as a necessity for businesses in contemporary times.
At the very center of social media marketing lies content, as brands successfully adopted quality, engaging, and captivating information to gain control over their audiences (Pulizzi, 2012). As Holliman and Rowley (2014) established from research, content marketing is a vehicle for enhancing customer trust and relationships while putting companies at the forefront of their industries. Each one of these forms of content involves social media: blogs, videos, infographics, podcasts, and live streams (Baltes, 2015).
Storytelling has an essential part in content marketing because it can help these brands relate with consumers at an emotional level. Research indicates that storytelling humanizes brands and improves audience retention as well (Lundqvist et al., 2013). A story well-written, alongside visuals and real experiences, magnifies brand authenticity and creates higher engagement (Gensler et al., 2013). For instance, Nike social media campaigns highlight stories of inspiring athletes whose aspirations strike a chord with the audience and match Nike's brand beat.
Literature Review
Since the pandemic's impacts have subsided, content marketing has been and will continue to be a driving force behind new kinds of digital advertising, especially in today's AI-based economy. According to recent scholarly studies, content marketing encompasses more than just blog posts and articles; it also includes webinars, interactive tools, and micro content created by artificial intelligence (Ahmad et al., 2023). Considering that analytics and insights from behavioural science are now primarily used to personalise content experiences, the emphasis has shifted to creating value for customers. More recent research findings centre on the importance of personalisation, especially when applied on a large scale. Kumar and Sharma (2024) state that tailored content has a multiplicative effect on engagement, conversion rates, and client retention. According to their e-commerce platform longitudinal research, personalising content marketing workflows increases customer lifetime value (CLV) by about 35%. Since personalised content is seen as a way to establish trust, this aligns with the original theories of relationship marketing.
The use of artificial intelligence and other forms of automation in content creation, curation, and dissemination is another development. Marketers can now create content practically immediately thanks to advancements in generative AI technologies like GPT models. But this hasn't alleviated marketers' concerns regarding authenticity and brand voice. Recent research by Müller & Grant (2023) demonstrated that AI content might increase content volume by 40%; but, in order to maintain emotional resonance and ethical compliance with brand principles, "human eyes" are necessary. Data analytics and performance metrics are becoming increasingly integral to content marketing efficacy. For example, Feldman et al. (2024) suggest using real-time data from user engagement, scroll depth, social sharing, and lead generation in dynamic analytics dashboards. In addition to facilitating A/B testing settings for content improvement, these will also make it easier for marketers to change tactics. There has never been a more efficient feedback loop between content strategy and performance.
Storytelling may be fundamental as a traditionally past form, but narrative has matured in itself. The products are often the centerpiece of these stories: they have turned into tales about community, sustainability, and identity. Kotler & Ingram (2023) state that these are "narrative-driven brand ecosystems," where companies use various means to create an interconnected tale to enhance user immersion. This type of transmedia storytelling adds value to brands by making them distinguishable in saturated markets while appealing to emotional processes of decision making. A similar trend is the increased focus on ethical content marketing. Consumers are very much inclined to be transparent now, since misinformation and algorithmic manipulation are the biggest issues facing market consumers. Li & Bukhari's (2023) research focuses on content credibility, particularly on social platforms where user-generated content and branded content often blur, adding to the debates over authenticity and reliability. From their research, they found out that brands that endorse disclosure and promise true content are preferable and trust them while they consume content.
Content quality is a major consideration to prove credibility in this fast-paced digital marketing setting. First-class information representing various hypotheses needs to be provided to build trust and cultivate loyal customers. In their research, Schellong et al. (2022) have highlighted the dual function of credible content, namely, that it provides the necessary information to the target audience and shows brand competence and integrity.Consumers are increasingly interested in discovering content that is aligned with their values and factual, going beyond mere appeal and persuasion. According to Zhang et al. (2021), cognitive trust is facilitated when consumers deem content to be informative, unbiased, and relevant to their needs.
Moreover, the content quality actively shapes the perceived authenticity and transparency of social media marketing, as noted by Kim and Ko (2023). This is when information favors the customer rather than sounding too commercial, which increases trust. Moreover, Kang & Namkung (2020) argue that congruity of content with brand identity is crucial, as any message deemed discordant with brand values is likely to see customers losing faith and switching allegiance. Hassan et al. (2022) further proved that regulated industries, including healthcare and banking, are likely to enjoy institutional trust in return for continuously adding quality content.
Interactive content is a trust booster in its best application. Polls, comments, and UGC- user generated content mechanisms foster user engagement and confidence, Alalwan (2021) remarks. These, however, can also be sabotaged by civility and accuracy control. Pulling together findings in the e-commerce field, Chae et al. (2022) proved that a combination of honest, detailed product descriptions with consumer reviews promotes trust massively since it diminishes perceived risks and garners transactional confidence.
The recent advent of AI generative content throws open an entirely new dimension to these discussions. Gupta and Kumar (2024) caution that while generative AI can scale up the production of content, the absence of fact-grounding or the lack of emotional resonance can result in loss of user trust if it is not judiciously curated. Hence, the role of human intervention in quality assurance still holds. Besides, according to the research by Lee et al. (2023), it was established that perceived ethical content handling such as transparency about data and no manipulation relates closely with consumer trust among Gen Z audiences; thus today, trust in content also depends on data ethics.
Research Objective
The research aims to investigate key factors affecting the customer experience while using AI-based content writing tools in social media marketing at an empirical level.
Research Gap
Category | Research Gap | Description |
Behavioural Insights | Lack of thorough behavioural research | Few researches look at psychological and emotional aspects influencing CX using artificial intelligence techniques on social media. |
Personalization Effect | Limited investigation of tailored content influences. | Little research on how user pleasure and engagement are affected by artificial intelligence personalising. |
Materials and Methods
This research is a descriptive research design aimed at systematically describing and interpreting factors that affect the experience of the users of content writing tools that are powered by AI and niched-in social media. Descriptive research is the most appropriate to use in this case because it provides avenues for understanding what, how, and to what extent different factors are affecting user experience without manipulation of variables. This specific study is based on purposive sampling methodology. Out of 310 responses obtained, 287 were utilised for the data analysis (removing incomplete responses, detecting and excluding outliers, and conducting reliability checks). The target population considered for this study is Digital marketers, social media influencers, content creators, and those business owners using AI-generated content. The Questionnaire was prepared using Google form and Likert scale questions were prepared. The data was collected and transferred to IBM SPSS & PLS SEM for analysis.
Proposed Research Model
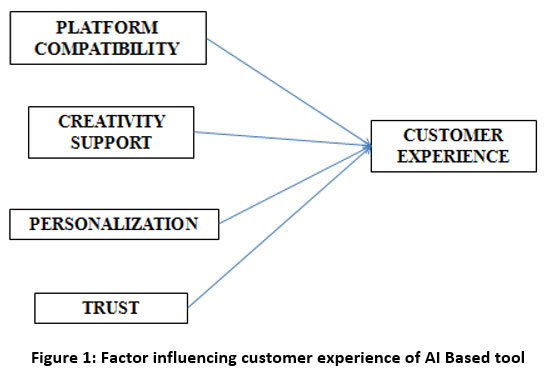 | Figure 1: Factor influencing customer experience of AI Based tool
|
Results
The procedure for analysis of the data is aimed at converting raw data from survey responses into insightful meaning, testing one's hypotheses, and establishing the validity of the suggested model of research.
Demography Analysis
Demographic analysis describes population characteristics. It usually is addressed to understand the composition, trends, and patterns of a particular group of people. The areas studied in demographic analyses include age, gender, income, education level, occupation, marital status, and geographical location. This evaluation provides knowledge of different peoples' behavioural patterns, needs, and preferences. Demographics are applied in many professions; for example, marketing deals with sociology, public policy, and economics to make decisions, adapt strategies, and build future forecasts.
Table 1: Demography Details
Sl. No. | Factor | Specific highlighting criteria | % of response |
1 | Age | Between 25 and 30 years | 90 % |
2 | Marital status | Married | 58% |
3 | Occupation | Private Employee | 65 % |
4 | Industrial Sector | Software | 77 % |
The demographic analysis of the respondents shows that the vast majority, at 90%, are aged between 25 and 30 years, indicating a young adult population. Most respondents are married, making up 58% of the total and thus demonstrating a reasonably balanced ratio for singles and married. The percentage of 65% private employees depicts a workforce primarily in the private sector. The representation of 77% of respondents from the software industry highlights a dominating presence from the IT sector.
Reliability Analysis of All the factors
In order to determine if the scale or questionnaire has a single internal-consistent latent construct, this test is conducted. For example, if a survey asks various questions to gauge customer happiness, it would be useful to check the reliability of each item to see if the results are consistent. An important test of internal consistency of a scale or questionnaire, it is commonly used in SPSS to calculate the Cronbach's alpha coefficient, which is a measure of reliability. Items with a high score (often ? ? 0.7) indicate a high level of reliability and trustworthiness. Researchers run the danger of basing their findings on inconsistent or even erroneous data if this step is skipped, casting doubt on the study's veracity.
Table 2: Reliability Test
Reliability Statistics | |
Cronbach's Alpha | N of Items |
.816 | 31 |
Reliability study was conducted on all variables utilising SPSS, yielding a Cronbach's Alpha value of 0.816 for the 31 scale items. This indicates that the internal consistency is elevated, implying that the items are strongly associated and dependable in assessing the same construct. A result exceeding 0.8 is deemed satisfactory, indicating that the scale is reliable and suitable for further statistical studies. The exceptionally high dependability indicates that the data gathered from respondents is consistent and credible, allowing for meaningful findings in the study.
Model Fit Summary
It is the aggregate of the goodness-of-fit estimates that detail quantitatively, how well the fitted model replicates the data observed.
Table 3: Model Estimates
Model Summaryb | |||||
Model | Râ | âR Square | Adjusted R Square | Std. Error of estimate | Durbin-Watson |
1 | .826a | .703 | .648 | 1.52975 | 1.925 |
a. âPredictors: (Constant), PC,CS,PS,TR | |||||
b. Dependent Variable: CE | |||||
There is a strong positive relationship between the dependent variable CE (Customer Experience) and the predictors PC (Platform Compatibility), CS (Creativity Support), PS (Personalization), and TR (Trust), as shown in the Model Summary, which indicates a multiple correlation coefficient of 0.826 in the regression model. With a R Squared value of 0.703, we can see that the four independent variables we looked at explain 70.3% of the variation in customer experience. After accounting for the sample size and number of predictors, the Adjusted R Squared value drops to 0.648, this is still indicative of a well-fitting model. A number of 1.52975 is the standard error of the estimate, which is the average distance between the observed value and the regression line. With a Durbin-Watson statistic of 1.925, which is near to 2, we may conclude that the residuals do not exhibit any substantial autocorrelation and that the independence assumption is correct.
Sampling Adequacy Test
Kaiser-Meyer-Olkin (KMO) and Bartlett's Test of Sphericity are two important statistical tests that determine if the data are sufficient for factor analysis. To determine how suitable the data is for structure detection, a KMO test calculates the proportion of variation among variables that might be common variance. Factor analysis is typically helpful when KMO values are near to 1 (about >0.6), but inadequacy of sample is indicated by values below 0.5. A similar test, the Bartlett Sphericity Test, looks for signs of discordance between the variables by comparing the correlation matrix to an identity matrix.
Table 4: Test for Sampling Adequacy
âKMO and Bartlett's Testâ | ||
Kaiser-Meyer-Olkin Measure of Sampling Adequacy. | .807 | |
Bartlett's Test of Sphericity | Approx. Chi-Square | 5184.412 |
df | 976 | |
Sig. | .000 | |
The data is adequate for factor analysis, according to the KMO and Bartlett's Test results, which show that the KMO Measure of Sampling Adequacy is 0.807. Conversely, there are sufficient correlations among the variables, as confirmed by Bartlett's Test of Sphericity, which is extremely significant (Chi-Square=5184.412, df=976, p<0.001). Thus, it is reasonable to conduct exploratory factor analysis on this dataset, given the combined results of the two tests support this.
Factor Analysis
When it comes to study in the social sciences and behavioural arts, factor analysis is among the most essential validations for the structure and reliability of measurement instruments. To do this, we must first find the latent structures, or factors, that explain the intercorrelation of the observed data. Factors with high loadings (often greater than 0.5) imply substantial correlations, according to this analysis. By comparing the amount of variation attributable to measurement error to the amount of variance by which an item correlates positively with the construct, we can find the Average variation Extracted (AVE). A value of 0.5 or more is deemed acceptable, suggesting satisfactory convergent validity. In contrast to Cronbach's alpha, which is more applicable when factor loadings are modified, Composite Reliability (CR) is defined as the measure of internal consistency of the construct; a CR value more than 0.7 would suggest a construct with good reliability. Typically, values above 0.7 are considered acceptable for Cronbach's alpha, a standard measure of internal consistency that examines the interrelatedness of items to determine the reliability of the scale. When taken as a whole, these measurement features provide a valid and trustworthy model, which boosts faith in the results.
Table 5: Factor loadings, AVE, CR and Cronbachâs alpha
Constructs | Factor loading | CR | AVE | Cronbachâs ? | ||||
Platform Compatibility | 0.820 | 0.690 | 0.763 | |||||
PC1 | 0.699 | |||||||
PC2 | 0.765 | |||||||
PC3 | 0.823 | |||||||
PC4 | 0.888 | |||||||
PC5 | 0.821 | |||||||
Creativity Support | 0.786 | 0.675 | 0.854 | |||||
CS1 | 0.711 | |||||||
CS2 | 0.710 | |||||||
CS3 | 0.734 | |||||||
CS4 | 0.680 | |||||||
CS5 | 0.720 | |||||||
CS6 | 0.760 | |||||||
Personalization | 0.864 | 0.656 | 0.765 | |||||
PS1 | 0.803 | |||||||
PS2 | 0.782 | |||||||
PS3 | 0.875 | |||||||
PS4 | 0.866 | |||||||
PS5 | 0.623 | |||||||
PS6 | 0.814 | |||||||
Trust | 0.713 | 0.637 | 0.819 | |||||
TR1 | 0.610 | |||||||
TR2 | 0.794 | |||||||
TR3 | 0.663 | |||||||
TR4 | 0.487 | |||||||
TR5 | 0.765 | |||||||
TR6 | 0.889 | |||||||
TR7 | 0.844 | |||||||
Customer Experience | 0.833 | 0.564 | 0.825 | |||||
CE1 | 0.797 | |||||||
CE2 | 0.843 | |||||||
CE3 | 0.617 | |||||||
CE4 | 0.788 | |||||||
CE5 | 0.777 | |||||||
CE6 | 0.870 | |||||||
CE7 | 0.844 | |||||||
Determining the Reliability and Validity of Measurement Constructs was accomplished through factor analysis alongside computations for Composite Reliability (CR), Average Variance Extracted (AVE), and Cronbach's alpha. Strong indicators of correlation among the items and their respective constructs were found, since all the item's factor loadings were greater than the lower limit of 0.5, with the bulk scoring greater than 0.7. The values of CR were found to be greater than the cut-off of 0.7 for the following constructs: Platform Compatibility (0.820), Creativity Support (0.786), Personalization (0.864), Trust (0.713) and Customer Experience (0.833), thereby confirming internal consistency. Values for Cronbach's alpha went from 0.763 till 0.854, also indicating supported reliability for these constructs. The AVE values were above the accepted range of 0.5 for all constructs ranging from 0.564 (Customer Experience) to 0.690 (Platform Compatibility), thus proving scales for convergent validity. This underpins that the measurement model is reliable and valid and is suitable for the following SEM and hypothesis testing.
Discriminant Validity Analysis
Discriminant validity is a measure used in research to assess how far apart a concept or construct really is from other concepts or constructs. It says that a variable or scale is not simply reflecting something else, and that it is an independent measure of the variable it was supposed to measure without overlapping appreciably with any unrelated variables. In other words, discriminant validity states that the two constructs in question are different. The more types of constructs one considers, the stronger the empirical results become. This form of validity is especially important in research that comprises studies with several constructs and it becomes necessary when using tools like surveys or questionnaires to ensure that each construct truly captures different aspects of the overall idea being looked at.
Table 6: Discriminant Validity
PC | CS | PS | TR | CE | |
PC | 0.830 | ||||
CS | 0.493 | 0.821 | |||
PS | 0.437 | 0.608 | 0.809 | ||
TR | 0.385 | 0.543 | 0.597 | 0.798 | |
CE | 0.294 | 0.424 | 0.481 | 0.524 | 0.750 |
On the diagonal is displayed the matrix values for whom the square roots of AVE average variance extracted for each construct are calculated, while the off-diagonal values display their correlations between constructs. As for the criteria provided by Fornell-Larcker, discriminant validity is met if for each construct, the square root of the average variance extracted (which is shown in diagonal elements) has to be bigger than the correlation values (off-diagonal elements) with respect to other constructs in the model.
Construct-by-Construct Analysis
Platform Compatibility (PC)
Square root of AVE = 0.830
Correlations with other constructs range from 0.294 (with CE) to 0.493 (with CS)
Since 0.830 > all its correlations, discriminant validity is established for PC.
Creativity Support (CS)
Square root of AVE = 0.821
Correlations with other constructs range from 0.424 (with CE) to 0.608 (with PS)
0.821 > all its correlations, indicating discriminant validity is established.
Personalization (PS)
Square root of AVE = 0.809
Highest correlation is with CS (0.608), followed by TR (0.597)
As 0.809 > all these values, discriminant validity holds for PS.
Trust (TR)
Square root of AVE = 0.798
Highest correlation is with PS (0.597), then CS (0.543)
With 0.798 > all correlations, discriminant validity is confirmed.
Customer Experience (CE)
Square root of AVE = 0.750
Highest correlation is with TR (0.524), followed by PS (0.481)
Since 0.750 is greater than all correlation values, CE also demonstrates discriminant validity.
SEM Algorithm Analysis
The SEM (Structural Equation Modeling) algorithm is defined as a statistical tool through which one can analyze the structural relationships between observed and latent variables within a model. The SEM algorithm can be understood as a combination of factor analysis and multiple regressions, checking at once a series of dependence relationships. SEM models usually consist of two sub-models: the measurement model, which specifies how latent constructs are measured by observed variables, and the structural model, which describes the relationship between the latent constructs.
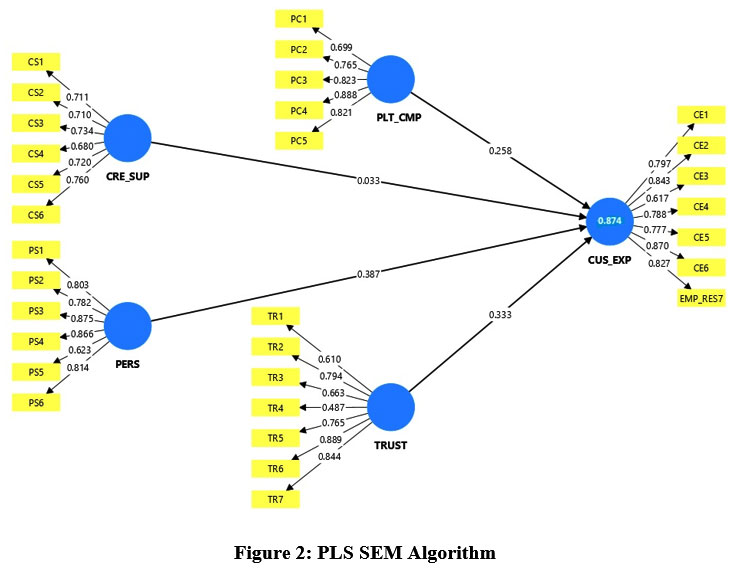 | Figure 2: PLS SEM Algorithm
|
Table 7: Statistical Analysis (Direct Effect)
Structural Path | Effects | Beta | t-values | p-values | Result |
PCÃ CE | Direct | 0.258 | 17.82 | 0.002 | Accepted |
CSÃ CE | Direct | 0.033 | 19.36 | 0.000 | Accepted |
PSÃ CE | Direct | 0.387 | 1.437 | 0.001 | Accepted |
TRÃ CE | Direct | 0.333 | 4.235 | 0.000 | Accepted |
The verification of direct effects for the structural model estimation generated using the PLS-SEM algorithm indicates that all the hypothesized direct effects are statistically significant and thus accepted. The path coefficient PCÃ CE indicates a beta value of 0.258 along with a t-value of 17.82 and a p-value of 0.002; thus, the direct effect is moderate and significantly positive. CSÃ CE has a rather small beta of 0.033 due to a high t-value of 19.36 and a p-value of 0.000. Therefore, CSÃ CE indicates a very small but statistically significant effect. On the other hand, PSÃ CE indicates a very high association, with a beta of 0.387, a t-value of 1.437, and a p-value of 0.001. Lastly, TRÃ CE presents a very strong effect with a beta of 0.333, a t-value of 4.235, and a very highly significant p-value of 0.000. Thus, these results firmly attest to the validity of the proposed structural paths and indicate that each construct contributes significantly to the explanatory power of the model.
Discussions
Optimizing the accompanying content generation tools and AI services, among others, must focus on multiple social media platforms including Instagram, Facebook, LinkedIn, and Twitter. It may be helpful to consider investing in platforms where seamless integration of the AI tool is paramount and outputs produced in a format and style that are consistent with the unique algorithmic and aesthetic expectations of each platform. Scheduling and publishing content capabilities should also address platform-dependent nuances so that they work more efficiently and smoothly.
Secondly creativity support has implications for managerial practice with relatively less direct impact. Managers must ensure that AI tools assume a wide array of language tones, story structures, and multimodal characteristics (e.g., image and video prompts) as helpful to content users who need refreshing and creative ideas. Training modules or examples that show very creative possibilities for the tool will help build user confidence and contribution. Managers should also consider periodically updating the tool's generative models to align the creative outputs with the latest trends and viral digital formats.
Third, the study found Personalization to be the most significant and positive cause of customer experience (? = 0.387). This suggests that AI content tools must provide a high level of personalization-from content tone and styling preferences to user behavioral data for improved targeting. Managers should commit to creating smart user profiles and corresponding preference-learning mechanisms so that the AI would grow alongside the user. The major priorities in their product development roadmap should center on brand voice cloning, adaptation to audience sentiment, and capabilities for niche targeting.
Trust in AI emerged as another primary dimension affecting the customer experience. Managers must be transparent about AI regarding its data sources, how content is generated, and ethical boundaries for its usage. Being transparent about when and how AI is involved in content generation will help gain user trust and counter skepticism. Besides this, human agency aspects must be integrated-for example, editing of content, review history, and plagiarism checks-to ensure the output remains accurate, humane, and legally publishable.
In addition, it was found that brand awareness and user engagement were affected by the quality and authenticity of AI-generated content; thus, managers should evaluate AI on an analytics dashboard that tracks user engagement with metrics such as engagement, conversion rates, and feedback loops that apply to content strategy. Organizations should embrace AI-generated content as a co-creative partner rather than the replacement of human creativity so that it retains ethicality, originality, and brand alignment.
Conclusion
The results of the present study reveal that four factors affect customer experience with AI-based content-writing tools accessed on social media: platform compatibility, creativity support, personalization, and trust in AI. Perceived personalization was the strongest determinant, signifying the necessity of developing preferred content with respect to customer behavior for greater satisfaction and engagement. This is consistent with earlier research findings supporting more personalized content leads to a deeper bond with users and broader customer lifetime value (Kumar & Sharma, 2024). Second, platform compatibility emerged as a positive influence on user experience; thus, maximizing AI tools' integration with several social media platforms makes them more usable and efficient. When content creation tools match platform-specific formats and interactions, users become likely to co-create content using these tools. Creativity support was of lesser influence but still very relevant. Users appreciate AI tools that help generate original and interesting content ideas, especially when they help tell stories that touch an emotional chordâa statement reconfirming the emphasis laid by existing literature in narrative-driven brand communication (Lundqvist et al., 2013; Kotler & Ingram, 2023). Trust in AI may also be a game-changer. The findings suggest that user trust in AI-generated content with regard to its ethical, transparent, and human-like nature is crucial to engendering that trust and ensuring continued use. Prior literature found that using content perceived to be genuinely authentic and ethically sound increases user trust and brand credibility (Lee et al., 2023; Li & Bukhari, 2023). The content qualityâdefined as the degree to which the content is accurate, structured, relevant, and originalâwas observed to be largely contributory to customer experiences. Users tend to be satisfied when the content is not only grammatically accurate but also trendy, relevant to their audience, and personalized with respect to their specifications. However, the originality of the content still remains questionable, alongside over-dependence on AI. These factors suggest the necessity of human moderation and post-processing of AI-generated material prior to publication, and thus support the position of Müller and Grant (2023), calling attention to the fact that human involvement is paramount in creating content that is consistent with a brand's voice and ethical standards.
Acknowledgement
The author would like to thank Faculty of Management, SRM Institute of Science & Technology, Kattankulathur for helping us to do the Research Work.
Funding Sources
The authors received no financial support for the research, authorship, and/or publication of this article.
Conflict of Interest
The authors do not have any conflict of interest.
Data Availability Statement
Data is available based on the request.
Ethics Statement
This research maintained ethical requirements, but no animals were involved.
Informed Consent Statement
This study ensured informed consent.
Permission to reproduce material from other sources
All the Tables and Figures produced in this research are entirely done by the researchers
Author Contributions
Surjadeep Dutta: Conceptualization, Methodology, Writing â Original Draft.
Paul Arun Kumar James: Data Collection, Analysis.
Prabhavathy Raja Ebenezer: Project Review, Editing.
Sarthak Sengupta: Project Editing and Inrerpretation.
References
- Ahmad, M., Tariq, R., & Zameer, H. (2023). Artificial intelligence in content marketing: Opportunities and challenges in the digital economy. Journal of Digital Marketing Innovation, 8(2), 112â129. https://doi.org/10.1016/j.jdmi.2023.04.006
- Alalwan, A. A. (2021). Investigating the impact of social media advertising features on customer purchase intention. International Journal of Information Management, 55, 102136. https://doi.org/10.1016/j.ijinfomgt.2020.102136
CrossRef - Ashley, C., & Tuten, T. (2015). Creative strategies in social media marketing: An exploratory study of branded social content and consumer engagement. Psychology & Marketing, 32(1), 15â27. https://doi.org/10.1002/mar.20761
CrossRef - Baltes, L. P. (2015). Content marketing â The fundamental tool of digital marketing. Bulletin of the Transilvania University of Brasov. Economic Sciences. Series V, 8(2), 111â118.
- Chae, H., Ko, E., & Han, J. (2022). Enhancing trust in e-commerce through detailed content and customer reviews. Journal of Retailing and Consumer Services, 66, 102896. https://doi.org/10.1016/j.jretconser.2021.102896
CrossRef - Dwivedi, Y. K., Kapoor, K. K., & Chen, H. (2020). Social media marketing and advertising. The Journal of Business Research, 117, 1â4. https://doi.org/10.1016/j.jbusres.2020.06.008
CrossRef - Felix, R., Rauschnabel, P. A., & Hinsch, C. (2017). Elements of strategic social media marketing: A holistic framework. Journal of Business Research, 70, 118â126. https://doi.org/10.1016/j.jbusres.2016.05.001
CrossRef - Feldman, J., Meyer, R., & Hart, B. (2024). Real-time analytics and performance metrics in dynamic content strategy. Journal of Interactive Marketing, 65, 45â60. https://doi.org/10.1016/j.intmar.2024.01.003
CrossRef - Gensler, S., Völckner, F., Liu-Thompkins, Y., &Wiertz, C. (2013). Managing brands in the social media environment. Journal of Interactive Marketing, 27(4), 242â256. https://doi.org/10.1016/j.intmar.2013.09.004
CrossRef - Gupta, V., & Kumar, A. (2024). Generative AI and content credibility: Balancing automation and human oversight. AI & Society, 39(1), 77â89. https://doi.org/10.1007/s00146-024-01520-z
- Hassan, S., Abbas, R., & Malik, M. (2022). Building institutional trust through regulated content marketing in healthcare and finance. International Journal of Bank Marketing, 40(3), 563â579. https://doi.org/10.1108/IJBM-08-2021-0354
- Holliman, G., & Rowley, J. (2014). Business to business digital content marketing: Marketersâ perceptions of best practice. Journal of Research in Interactive Marketing, 8(4), 269â293. https://doi.org/10.1108/JRIM-02-2014-0013
CrossRef - Kang, J.-W., & Namkung, Y. (2020). The congruity effects between brand identity and content type on social media. Journal of Business Research, 113, 149â160. https://doi.org/10.1016/j.jbusres.2019.10.054
CrossRef - Kaplan, A. M., & Haenlein, M. (2010). Users of the world, unite! The challenges and opportunities of Social Media. Business Horizons, 53(1), 59â68. https://doi.org/10.1016/j.bushor.2009.09.003
CrossRef - Kim, A. J., & Ko, E. (2023). Perceived authenticity in social media content: Exploring the influence of informational value. Journal of Marketing Communications, 29(2), 132â148. https://doi.org/10.1080/13527266.2020.1852161
- Kotler, P., & Ingram, R. (2023). Narrative-driven ecosystems: A new paradigm for brand storytelling. Journal of Marketing Management, 39(1â2), 23â42. https://doi.org/10.1080/0267257X.2022.2146582
- Kumar, P., & Sharma, R. (2024). Personalized content marketing and consumer lifetime value: Evidence from e-commerce. Journal of Business Research, 166, 312â324. https://doi.org/10.1016/j.jbusres.2023.113643
CrossRef - Lee, M., Tan, K. W., & Chan, C. (2023). Gen Z and ethical data practices: A trust-based approach to AI-driven marketing. Information Systems Frontiers. Advance online publication. https://doi.org/10.1007/s10796-023-10376-7
- Li, H., & Bukhari, F. (2023). Transparency and authenticity in influencer and brand-generated content: Consumer perspectives. Journal of Consumer Behaviour, 22(1), 94â107. https://doi.org/10.1002/cb.2015
CrossRef - Lundqvist, A., Liljander, V., Gummerus, J., & van Riel, A. (2013). The impact of storytelling on the consumer brand experience: The case of a firm-originated story. Journal of Brand Management, 20(4), 283â297. https://doi.org/10.1057/bm.2012.15
CrossRef - Mangold, W. G., & Faulds, D. J. (2009). Social media: The new hybrid element of the promotion mix. Business Horizons, 52(4), 357â365. https://doi.org/10.1016/j.bushor.2009.03.002
CrossRef - Müller, J., & Grant, P. (2023). AI content creation: Enhancing volume or diluting voice? Journal of Marketing Analytics, 11(2), 124â138. https://doi.org/10.1057/s41270-023-00155-3
- Pulizzi, J. (2012). The rise of storytelling as the new marketing. Publishing Research Quarterly, 28(2), 116â123. https://doi.org/10.1007/s12109-012-9264-5
CrossRef - Schellong, A., Hohenthal, J., &Widén, G. (2022). Quality content as a trust-building mechanism in digital marketing. European Journal of Marketing, 56(7), 1884â1904. https://doi.org/10.1108/EJM-10-2021-0795
- Statista. (2023). Number of social media users worldwide from 2017 to 2027. https://www.statista.com/statistics/278414/ number-of-worldwide-social-network-users/
- Stelzner, M. A. (2021). Social media marketing industry report: How marketers are using social media to grow their businesses. Social Media Examiner. https://www.socialmediaexaminer.com/social-media-marketing-industry-report-2021/
- Tuten, T. L., & Solomon, M. R. (2017). Social media marketing (3rd ed.). SAGE Publications.
- Zhang, X., Zhao, K., & Xu, X. (2021). Cognitive trust and content relevance in brand communication. Journal of Interactive Advertising, 21(2), 153â170. https://doi.org/10.1080/15252019.2021.1932805
- Kumar, S., & Sharma, A. (2024). Personalization and its influence on customer lifetime value in content marketing. Journal of Marketing Analytics, 12(1), 33â45.
- Kotler, P., & Ingram, J. (2023). Narrative-driven brand ecosystems: A new paradigm in marketing. Marketing Theory, 21(4), 489â507.
- Lee, J., Kim, S., & Patel, A. (2023). Ethical content handling and Gen Z trust in AI-generated content. Journal of Business Ethics, 180(2), 345â362.
- Li, X., & Bukhari, A. (2023). Transparency and trust in content marketing on social media. Digital Marketing Insights, 9(2), 98â112.
CrossRef - Müller, R., & Grant, T. (2023). The role of human curation in AI-generated content marketing. AI and Society, 38(1), 59â74.

This work is licensed under a Creative Commons Attribution 4.0 International License.


