
Ecuadorian Manufacturing Companies in Pandemic: Comparative Analysis of Bankruptcy Forecast
Irene Buele*  , Christian Inga and Joselyn MejÃa
1Accounting and Auditing, Universidad Politécnica Salesiana, Cuenca, Ecuador .
The Altman Z-Score model helps to determine the possibility of a company's bankruptcy, offering the opportunity to make corrective decisions in a prompt manner. This article compares the financial situation of manufacturing companies in the years 2019 and 2020, through the analysis of financial ratios and the Altman Z-Score model. This research aims to determine the changes in the financial situation and the probability of bankruptcy in the first year of the Covid-19 pandemic. The results show a negative impact on liquidity (0.11%), the profitability showed an increase of 4%, demonstrating that profits have been generated despite the fact that sales did not increase. The probability of bankruptcy is 2.22 for manufacturing companies in 2019 and 1.97 for 2020, because of a 10% decrease in sales.
Copy the following to cite this article:
Buele I, Inga C, Mejía J. "Ecuadorian Manufacturing Companies in Pandemic: Comparative Analysis of Bankruptcy Forecast". Journal of Business Strategy Finance and Management, 6(1).
Copy the following to cite this URL:
Buele I, Inga C, Mejía J. "Ecuadorian Manufacturing Companies in Pandemic: Comparative Analysis of Bankruptcy Forecast". Journal of Business Strategy Finance and Management, 6(1). Available here:https://bit.ly/3T9Rmzo
Citation Manager Publish History


Introduction
On the last day of 2019, the World Health Organization (WHO) was notified by the Chinese health authorities of a new disease in the city of Wuhan (Garcia, 2020). Subsequently, on January 7, 2020, WHO announced that a coronavirus commonly known as Covid-19 had been detected; and a few months later, on March 11, 2020; it was proclaimed as a pandemic. It brought with it global negative economic, political, and social consequences (Planifica Ecuador, 2020).
Santiago and Vargas (2020) point out that at the end of May 2020, Latin America and the Caribbean became the world epicenter of the Covid-19 pandemic. To slow down the spread of the disease, governments established measures, such as quarantine, social isolation-distancing, border closures, suspension of international flights and economic activities (Pierre & Harris, 2020). However, these adopted measures led to a total or partial interruption of production, which affected various sectors. The most affected industries were the wholesale and retail trade, manufacturing, and the provision of services, such as tourism, hotels and restaurants, along with the health, education, and real estate sectors (Universidad Técnica Particular de Loja, 2020).
The Economic Commission for Latin America and the Caribbean (ECLAC) (2020) points out that this crisis hit the industrial sectors the most severely, as their cash flows dropped and they had problems to continue with their operations. The industrial sector had the following complications: inability to pay workers, pay off debts, and difficulty obtaining financing for working capital.
The Ecuadorian Manufacturing Industry
The present research studies manufacturing companies, which are those engaged in the process of industrialization. Camino et al. (2018), indicates that industrialization constitutes the central axis in the economy of the countries. For Horna et al. (2009) the manufacturing industry strengthens the socio-economic development of any country. They have the function of converting raw materials into a finished product ready for sale through an industrial process.
In Ecuador, during 2019, the manufacturing sector was the most important in the country, because it generated 10% of jobs, providing 12.53% of the country's total production and contributing with $9 billion to the national economy; followed by the commerce sector, whose participation was $7.3 billion (10.25% of GDP) (Lucero, 2020). However, the manufacturing sector was affected by the pandemic, which caused a high number of infections in Ecuador. This led President Lenín Moreno, on March 16, 2020 to declare a national state of emergency, through Executive Decree No. 1017, resulting in the suspension of economic activities and work, except for sectors, such as health, security, and other strategic areas (Ombudsman's Office of Ecuador, 2020).
The pandemic resulted in a decrease of 12.4% in Ecuador's GDP in 2020 compared to the 2019 period. Such decline was due to investment falling by 18.5%; exports of goods and services declined by 15.7% and household final consumption expenditures declined by 11.9%; making GDP to be $15.79 billion in real terms. However, the reduction in GDP was lower than that of other nations in the region, such as in Chile, which fell by 14.1%; in Colombia the fall was 15.7%; in Mexico 18.7%; in Argentina 19.1% and in Peru it was 30.2% (Banco Central del Ecuador, 2020).
As a consequence of the above scenario and the relevance of the manufacturing sector in the country's economy, it is significant to perform a comparative analysis of the financial situation and bankruptcy forecast before Covid-19 (year 2019) and in its first year (2020), through financial ratios and the Altman Z-Score model, in order to determine the financial impact and changes in the probability of bankruptcy of the companies with the arrival of the pandemic.
Financial Analysis and Bankruptcy Forecast
A financial analysis allows assessing the situation and the historical and current economic-financial performance, to detect difficulties and apply solutions (Lavalle, 2016). In turn, Puerta et al. (2018) indicate that it is a fundamental tool for financial management, since it is based on the calculation of financial ratios that indicate the liquidity, solvency, activity, indebtedness and performance that a company has. On the other hand, it also serves to make future projections, information that is useful for internal and external stakeholders. In addition, with financial analysis, financial decisions can be better made to maintain the profitability of the company (AELDE Business School, 2020). Therefore, the decisions made on the basis of the study will contribute to the future of manufacturing companies, so that over time, they do not take the risk of becoming insolvent and adopt strategies that improve financial performance (Van & Wachowicz, 2010).
On the other hand, Catucuamba et al. (2018) indicate that the challenges faced by investors and managers have been the possibility of predicting whether a company will go bankrupt or will have the stability to enable it to remain in time. In this sense, with the implementation of a model that forecasts business failure, management will be able to propose financial strategies to improve its economic-financial situation and make the best decisions for the future of the company (Guzmán et al. (2019).
To determine whether companies are financially healthy or headed for failure, multiple bankruptcy forecasting models have been created. Among the most prominent are William Beaver's (1966) single-variable model, Edward Altman's (1968) discriminative analysis model, and James Ohlson's (1980) conditional probability model in the case of solvency (Gómez & Leyva, 2019).
When the financial situation is serious and a company becomes insolvent, there is suspension of payments, thus running the risk of business failure. According to Llano et al. (2016) and Rivera (2021) business failure is a problem that has always existed and due to Covid-19, a lot of companies find themselves in the uncertainty of their survival. For this reason, it is necessary to make the respective evaluations to predict the risks that may compromise the future of the companies, so it is necessary to use a model that helps to measure the risk of failure.
The single-variable analysis model was the first statistical model to predict bankruptcy of a company by a simple discriminant analysis, whose objective was to test the predictive ability of financial indexes, instead of finding predictors of bankruptcy; its theory is to test the use of indexes so that accounting data can predict bankruptcy (Gnecco et al., (2020).
To improve the accuracy of bankruptcy prediction, multi-variable statistical methods are used. Altman Z-Score makes an analysis that fits the needs of different sectors and generates the multiple discriminant analysis (MDA), which through a statistical analysis, weights and calculates the addition of five financial ratios for classifying companies as solvent and insolvent according to their discriminative function (Gómez & Leyva, 2019).
On the other hand, James Ohlson's model consists of logistic regression analysis (Logit) and considers that the factors for the company to be successful are: the size of the company, financial structure indicators, performance and current liquidity (Tascón & Castaño, 2012). This model, even not being successful, contributed to the development of the financial independent variables, which are three financial ratios: profitability, indebtedness and liquidity (Almeida, 2019; Gallardo & Garrido, 2016).
In this research, the Altman Z-Score model is used, as it is the most widely used and accepted model, generating 95% reliability to determine the bankruptcy and insolvency of companies and thus classify them into, healthy companies (solvent), sick (insolvent) and those in the gray zone or danger of bankruptcy (Rivera, 2021). Salazar and Silva (2019) indicate that Edward Altman's (1968) model collects the indicators that identify the financial strengths of companies, in order to define when the company is at risk of bankruptcy (Tejada et al., 2017). Then, this model measures the probability of bankruptcy in the future of a company, by means of multivariate analysis of financial ratios, using the discriminative analysis technique (Guzmán et al., 2019).
Tejada et al. (2017), mention that, the Altman Z-Score model is founded on multiple discriminant analysis and that the five financial ratios, which are sufficient to identify companies with financial difficulties are: liquidity, profitability, leverage, solvency and activity, these being the ones that best predict the probability of bankruptcy. The value resulting from the discriminant analysis was called "Z-value". The following is an analysis of each of the variables used in the Altman Z-Score model.
Table 1: Variable Description
|
Discriminant Variable |
Formula |
Measurement |
|
X1 |
Working Capital/Total Assets |
It evaluates the ability to generate liquidity. |
|
X2 |
Retained Earnings/Total Assets |
It assesses cumulative profitability, shows the company's own funds, and measures the return on all assets for every dollar invested. |
|
X3 |
Earnings before Interest and Taxes /Total Assets |
It evaluates the operational capacity to form profitability in the short term. |
|
X4 |
Total Equity/Book Value of Total Liability |
It evaluates the solvency, shows the company's ability to pay. |
Source: Naula et al. (2020) and Rivera (2021)
Based on the aforementioned, the objective of this work is to analyze and compare the financial situation and the bankruptcy forecast of manufacturing companies for the years 2019 (before the pandemic), and 2020 (the year of the pandemic outbreak). All of this by calculating financial ratios obtained from accounting data, to diagnose the financial situation of organizations and predict a corporate bankruptcy based on the Altman Z-Score model.
In similar research, applying Altman Z-Score, it has been observed that Mexican companies listed on the Stock Exchange because of COVID-19 had their financial results for the first quarter of 2020 affected, showing a risk of bankruptcy (Morales, et al. 2021). While Bermeo and Armijos (2021), in their study carried out on building construction companies in Ecuador, determined that 38% were in the bankruptcy zone between 2014 and 2018. A study carried out on Ecuadorian flower companies determined that the majority Part of companies are in a bankruptcy zone, in a study from 2014 to 2018 (Aldáz, 2021). In a study carried out on manufacturing companies in Ecuador, from 2015 to 2019, it is observed that small companies have the highest risk of bankruptcy with 22.8% (Mera, 2021). On the other hand, research such as that carried out on the Istanbul Stock Exchange indicates that companies in the real estate, financial services, technology, and wholesale and retail sectors recorded increases in value once the long lockdown periods expired due to the Covid 19 pandemic (Ali Balc?, et al., 2022).
Materials and Methods
A quantitative methodology was used for this research, obtaining accounting data from official sources, in this case, from the website of the Superintendence of Companies, Securities and Insurance (SUPERCIAS). The target population was composed of 431 manufacturing companies located in the province of Azuay, registered in the business directory. Subsequently, a representative sample of this population was chosen using the finite sample size formula (1), with a confidence level of 94%. Thus, a total sample of 155 companies to be analyzed was obtained, from the following formula:
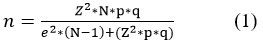
Where:
Z = Confidence level
p = Percentage of the population that has the desired attribute
q = Percentage of the population that does not have the desired attribute =1-p
N = Size of the universe
e = Maximum accepted estimation error
n =Sample size
The following types of companies are found in the selected sample: Limited Liability Companies, whose purpose is to carry out civil and commercial acts; Corporations, which are formed by two or more individuals characterized by their capital, which is divided into negotiable shares and are liable only for the amount of their shares; and Simplified Joint Stock Companies, which are formed by one or more individuals in which the liability of the partners is limited to the amount of their contributions.
Once the number of sample units were calculated, the companies with complete financial statements for the years 2019 and 2020 were randomly selected. A database was constructed with the selected sample containing the Statements of Financial Position and Comprehensive Income Statements for the years 2019 and 2020, where the types of financial ratios, detailed in Table 2, and the Altman Z2-score Model (2) were applied.
Table 2: Financial indicators that will be applied in the research.
|
Financial ratio |
Type of financial reason |
Description |
Formula |
|
Liquidity |
Current Index |
They measure a company's ability to cover its liabilities in the short term. |
D = PT/AT*100
|
|
Acid Test |
It measures the ability to meet its obligations with its most liquid resources. |
PA = (AC -I)/PC |
|
|
Activity |
Asset Rotation |
It measures the relative effectiveness of all the company's assets in producing sales. |
RA = V/TA |
|
Indebtedness |
Debt |
It measures the degree to which the company uses external financing. |
D = PT/AT*100 |
|
Profitability |
Operating Profit Margin |
It shows the operating profit in relation to sales; In addition, it indicates whether or not it is earning profits despite its operating costs. |
MUO = UO/V*100 |
Source: Van and Wachowicz, (2010), Cruz (2017), Carchi et al. (2020)
For a better understanding of the average sales reduction between 2019 and 2020, the formula for calculating decreases was used and it was called average sales, because the manufacturing companies analyzed had several types of activities, and since each activity did not have the same behavior, an average was calculated between all the activities for each year to analyze their behavior and variation between the two years. The average operating profit margin was calculated by applying the operating profit margin formula and averaging the number of companies that have each activity, in order to analyze the average changes that each activity had between 2019 and 2020.
To understand the behavior of profitability by economic activity, the total of the companies analyzed by economic activity was considered. Therefore, the Operating Profit Margin for the years 2019-2020 was taken, considering the operating profit and sales in each of the activities changes, thus demonstrating those increases and decreases.
With the use of the Altman Z-score Model, the bankruptcy forecast of the manufacturing entities of the province of Azuay was determined, helping to determine the changes that occurred in the probability of bankruptcy of the companies between 2019 and 2020. In addition, the variables that influenced the changes in the probability of bankruptcy were determined. The formula of the model is detailed below:

Where:
X1 = Working Capital / Total Assets.
X2 = Retained Earnings / Total Assets
X3 = Earnings Before Interest and Taxes / Total Assets
X4 = Total Equity / Book Value of Total Debt
Z = General Index
Tejada et al. (2017) establishes the following classification of the Altman Z-score:
1. If it is below 1.23 (danger zone) there is the possibility of bankruptcy.
2. If it is between the range 1.23 and 2.90 (gray zone) it is within the zone of ignorance. It is not clear whether it is in the danger or safe zone (Lodeiro, 2013); therefore, the respective measures must be taken for improvement and to avoid being in the danger zone.
3. If the index is located at a level above 2.90 (safe zone) there is no possibility of bankruptcy indicating that it has solvency; consequently, it has a good financial performance to continue in the market (Hernandez, 2014).
Results and Discussion
The results presented are divided into two sections. First, a comparative analysis of the financial situation between 2019 and 2020 is presented. Secondly, a comparative analysis of the results of the bankruptcy forecast for the aforementioned years is presented.
Table 3 describes the randomly selected sample, which includes 29% of Public Limited Companies, which carry out 12 of 13 activities in the manufacturing sector; whereas 70% corresponds to Limited Liability companies, which carry out all 13 activities in the sector. The Limited Liability companies include companies of corporate and family groups, while the Limited Liability companies are formed by partners with no relationship of affinity or consanguinity.
Table 3: Description of the sample analyzed.
|
Company type |
Percentage of companies |
Number of economic activities |
|
Limited Liability Company |
70% |
13 |
|
Public Limited Company |
29% |
12 |
|
Simplified Shares Company |
1% |
2 |
|
Total |
100% |
Source: Elaborated by the authors
Table 4 shows the type of activity and the percentage of the same in the manufacturing sector, as a result, 13 different activities were obtained, which are: Metals, Non Metals and Oil, Manufacture of Pharmaceutical Products, Apparel Products, Manufacture of Vehicles and Derivatives, Printing and Reproduction of Recordings, Manufacture of Machinery and Equipment, Computer Products, Beverage Processing, Other Manufacturing Industries, Manufacture of Wood Products, and Manufacture of Paper and Cardboard.
The companies that stand out according to their value by level of assets are: Graiman Co. Ltda., Italpisos S.A, and Tubería Galvanizada Ecuatoriana, included in Metals, Non-Metals, and Oil; there are also the enterprises Induatenas S.A and Alimentos Italimentos S.A, dedicated to Pharmaceutical Products; and lastly the company Pasamanería S.A from the Apparel Products sector.
Table 4: Economic activities that comprise the sample.
|
Economic activity |
Percentage of companies |
|
Metals, Non-Metals, and Oil |
23,42% |
|
Manufacture of Pharmaceutical Products |
13,92% |
|
Food processing |
13,29% |
|
Apparel Products |
13,29% |
|
Manufacture of Vehicles and Derivatives |
6,96% |
|
Manufacture of Furniture |
5,06% |
|
Printing and Reproduction of Recordings |
5,06% |
|
Manufacture of Machinery and Equipment |
5,06% |
|
Computer Products |
5,06% |
|
Beverage Processing |
5,06% |
|
Other Manufacturing Industries |
4,43% |
|
Manufacture of Wood Products |
1,90% |
|
Manufacture of Paper and Cardboard |
1,27% |
|
Total |
100,00% |
Source: Elaborated by the authors
Comparative analysis of the financial situation
Figure 1 shows the comparison between the current index and the acid test between the years 2019 and 2020. The current index presents a decrease in the liquidity of the companies. This was not good due to the pandemic and confinement of the year 2020. The manufacturing industry had a reduced performance, especially in the months of March and April where it presented negative growth rates of -10.48% and -16.39% (Lucero, 2020). Likewise, the performance of the manufacturing sector was significantly reduced in April with -26.50% of the Manufacturing Industry Production Index (IPI-M) as a result of the paralysis of the economic activities. This provoked a 0.11% decrease in liquidity, which indicates that in 2020 it presented a lower capacity to cover its current obligations. It is understood that accounts receivable, inventories and cash decreased due to the situation caused by the restrictions given by the Covid-19 advent.
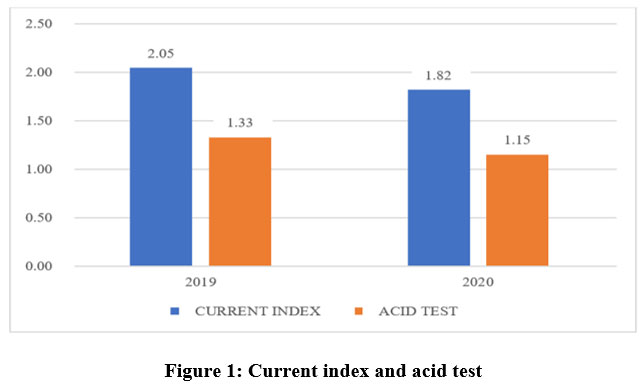 |
Figure 1: Current index and acid test |
The acid test also showed a decrease between 2019 and 2020, falling by 0.13%, demonstrating the importance of inventories in the sector, since, without taking them into account, there is no immediate availability to cover current obligations. This occurs due to the reduction of sales in the year 2020 affecting the items: cash, accounts receivable and inventories, which will decrease if sales drop. Despite these results, in the study "Analysis of financial performance in an environment of uncertainty, in the manufacturing sector of the province of Cotopaxi" in the year 2018 it had already been presenting liquidity problems, since the current index was $1.23 and the acid test was $0.83 (Fernandez, 2020).
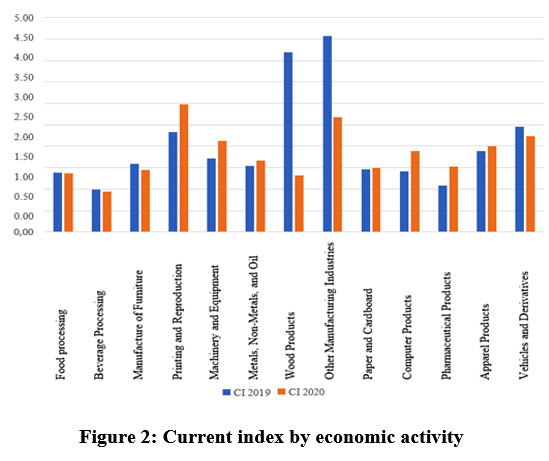 |
Figure 2: Current index by economic activity Click here to view Figure |
Figure 2 shows the current index by economic activity of the sector, which, depending on the activity, shows either increase or decrease. The activities that show an increase in this indicator are Pharmaceuticals, Telecommunications (communication devices), Printing and Reproduction, Machinery and Equipment. And the activities that showed a decrease were Beverage Processing, Wood Products and Vehicles and Derivatives. This is verified by contrasting the above results with those obtained in the article of the authors Carchi et al. (2020) ¨Índices financieros, la clave de la finanza administrativa¨, where the processing operations of Wood products, but Furniture, had a current index in 2018 of 0.96%, in 2019 of 4.19%, and in 2020 of 1.31%, presenting a significant decrease due to the pandemic.
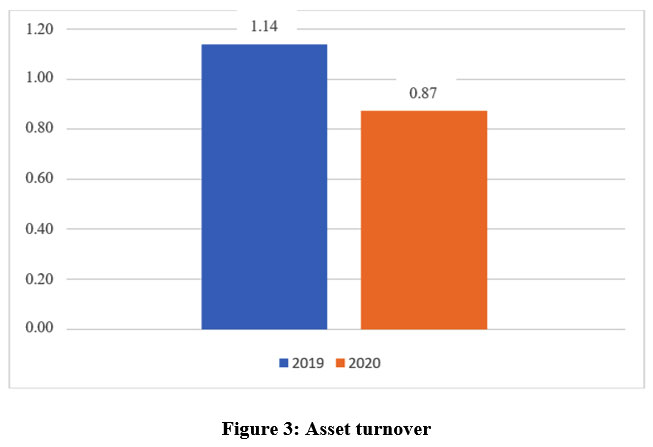 |
Figure 3: Asset turnover Click here to view Figure |
In Figure 3, asset turnover also decreases in 2020 by 0.23%, being this rate poor compared to 2019. This is corroborated by the sales recorded in 2020, where the capacity of the assets to generate revenue is inefficient, as these generated fewer volumes of sales in relation to 2019. The inefficiency of total assets to produce sales had a significant impact due to the decrease in sales caused by the pandemic. This decrease occurred in the following activities of the sector: Beverage Processing; Wood Furniture Manufacturing; Printing and Reproduction (Telecommunications); Metals, Nonmetals and Petroleum; Other Manufacturing, Apparel Products; and Vehicles and Derivatives. This decrease is due to the loss of individuals' goods purchasing power; therefore, there was a decrease in demand, mainly in the months of co-financing (Banco Central del Ecuador, 2020).
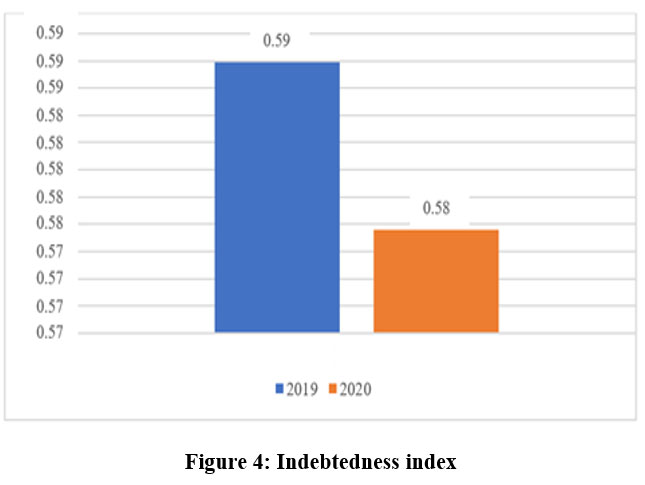 |
Figure 4: Indebtedness index Click here to view Figure |
Figure 4 shows the indebtedness ratio, which correlates the total of liabilities with equity. This indicator decreased in 2020, indicating the relative degree of financing of own and external resources. In 2019, the investment of creditors in assets was higher, although the indebtedness also depended on the type of economic activity of the sector. On the other hand, the year 2020 presented a positive aspect, which is that the equity and total assets of the manufacturing companies increased, showing that the participation of the shareholders increased, since the lower this ratio, the higher the degree of shareholder financing. This decrease is significant compared to the one shown in the article, " Análisis del desempeño financiero en un entorno de incertidumbre" by Fernández (2020), which indicates that the debt ratio of the sector, in 2018 is $1.03. Evidencing that in such year, the participation of creditors was higher. In 2020, only 15% of manufacturing companies reported that the participation of third parties was greater than that of the shareholders. It can be said that, as a result of Covid-19, financing was mainly provided by the shareholders.
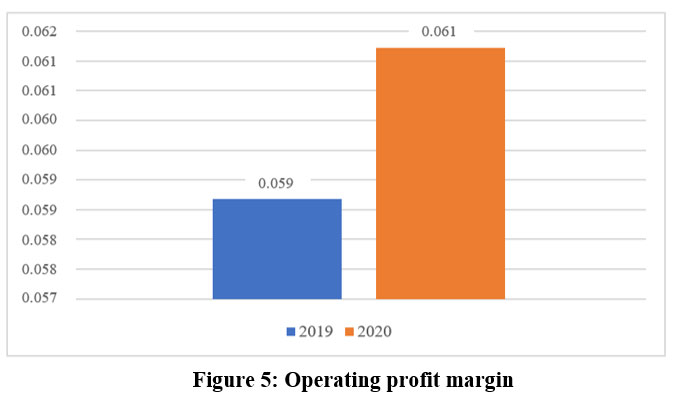 |
Figure 5: Operating profit margin Click here to view Figure |
Figure 5 evaluates the operating profit margin, which shows an increase of 0.04%. Despite the fact that sales decreased in 2020, the operating profit increased in this year. For each dollar of sales an operating profit of 0.061 cents was obtained, therefore, Covid-19 had no effect on the operating profit of the manufacturing companies studied. At the same time, expenses were also reduced in order to achieve these results, so it can be concluded that they adopted strategies to reduce their expenses and obtain profits. One example is the reduction of their financial expenses, by cutting back on third-party financing. On the other hand, only 19% of manufacturing companies had an increase in operating profit; it increased only 0.04% in relation to the year 2019 while sales decreased significantly in 2020, as a result of Covid-19. This may be due to the fact that, in the month of May 2020, there was economic recovery of this activity, producing a monthly growth of 41.69%; and in the month of June 2020, the manufacturing of products grew rapidly, which represented a relief for the generation of employment and national production (Lucero, 2020).
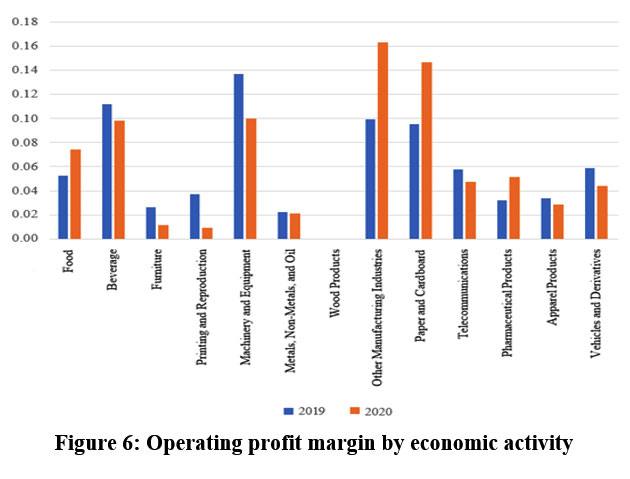 |
Figure 6: Operating profit margin by economic activity Click here to view Figure |
The Operating Profit Margin by economic activity shows the following average growth: Food Processing with 0.42%; Other Manufacturing Industries 0.65%; Paper and Cardboard Manufacturing 0.54% and Pharmaceutical Manufacturing 0.61%. These were the only activities that presented an increase in their operating profit, due to the increase in their sales. The activities that presented decrease in operating profit with the arrival of Covid-19 are: Vehicles and Derivatives -0.25%; Metals, Non-Metals and Petroleum -0.05, Beverage Manufacturing -0.12%; Furniture Manufacturing -0.56%; Printing and Reproduction -0.75%; Machinery and Equipment -.0.27%; Computer Products -0.18% and Apparel Products -0.14%. In this financial ratio wood products did not present profits in 2018, 2019 and 2020. When compared to the article of Buele et al. (2021) "Análisis Financiero y Pronóstico de Fallas Empresariales" applied to manufacturing companies, the result is the same. This is not representative since their result remains at zero.
Comparative analysis of the bankruptcy forecast
The probability of bankruptcy of the manufacturing companies in 2019 was 2.22 and for 2020 it was 1.97. In addition, it is important to highlight that the Food, Paper and Cardboard, and Pharmaceutical activities were the only ones that decreased their probability of bankruptcy since these were the only ones whose sales grew with the arrival of Covid-19, due to the fact that the products they offer were more in demand during the pandemic. This result is consistent with the article by Tigsi (2020), where he mentions that manufacturing companies increased the probability of bankruptcy by 2020.
While the arrival of Covid-19 affected manufacturing companies financially, the Food and Pharmaceutical manufacturing sectors were not negatively impacted, since thanks to the goods they offer and their high demand during Covid-19, their sales grew by 10%, thus decreasing their probability of going out of business.
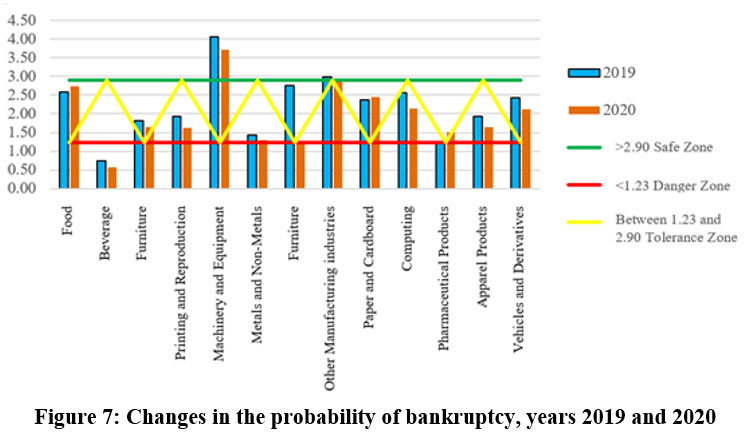 |
Figure 7: Changes in the probability of bankruptcy, years 2019 and 2020 Click here to view Figure |
Conclusions
Covid-19 affected the liquidity of manufacturing companies in 2020, due to the fact that their accounts receivable and inventories decreased, causing 31% of manufacturing companies to have problems to cope with their debts in the short term. The arrival of Covid-19 has affected the liquidity of manufacturing companies in particular; the current ratio showed a reduction of -0.11%, the acid test was -0.13% and the activity ratio was -0.23%. In turn, the indebtedness index showed a decrease of -1%, while profitability, although not in all the activities of the sector, showed a growth of 4%.
In turn, Covid-19 also affected the activity index, because sales decreased despite the increase in total assets, indicating that companies were inefficient in using their assets to generate sales and demonstrating that they generated fewer sales for each dollar of investment. Finally, this indicator decreased by 0.02%, despite the fact that in the year 2020 their investment in total assets increased, but sales decreased. The cause would be the low demand generated by Covid-19, especially in the activities of Wood products, Other Industries, Paper and Cardboard and Vehicles and Derivatives. Only 15% of the activities were efficient in generating sales per dollar of investment.
Regarding the indebtedness index, in 2019 the financing of the creditors was greater than that of the shareholders, and in 2020 there was a decrease of 1%. This indicates that the financing of the partners was greater than that of the creditors, due to the fact that the partners contributed with more resources to avoid committing to third-party financing in order to continue operating. Although there were few manufacturing companies that presented an increase in their indebtedness index. In relation to Covid-19, there is evidence that the manufacturing companies did not request financing from third parties since they had the necessary resources to carry out their activities, and they also reduced some expenses, indicating that management in this aspect has been effective.
On the other hand, the Operating Profit Margin showed an improvement between 2019 and 2020. Despite the arrival of Covid-19, the companies generated profits in relation to their costs. In 2020, these firms showed a positive variation of 4%, even though they were in a not very favorable economic situation, in which, due to the pandemic, some of them went bankrupt since they did not have the necessary resources to continue operating, and others, on the other hand, had to implement strategies to reduce expenses. In turn, the Food and Pharmaceutical activities showed significant growth, due to the fact that their sales and profits in 2020 increased by 28%.
With the arrival of Covid-19, the analyzed manufacturing companies increased the probability of going bankrupt by 11%, due to the reduction of their sales. Regardless of the activity of the companies, all of them are prone to go bankrupt for external or internal reasons. Of the companies analyzed, 27% are in a safe zone, 19% in a gray zone and 54% in a sick zone, which, according to the model, will probably go bankrupt if they do not take the necessary measures in the next few years. Finally, the companies are in the sick zone because they do not have good working capital, their profits do not accumulate, and their sales were reduced with the arrival of Covid-19.
In addition, the 10% decrease in sales compared to the previous year, also had a direct impact on the increase in the probability of bankruptcy. In addition, the companies suffered losses in the results of fiscal year 2020, which led to a 48% decrease in profitability, and 42% of the companies analyzed, are in a danger zone, to the point where they could go bankrupt in the next few years if they do not adopt measures or strategies in time.
Acknowledgments
The author would like to thank Politécnica Salesiana University for providing its facilities and computer equipment for the research.
Conflict of Interest
The author(s) declare no conflict of interest.
Funding source
The Politécnica Salesiana University will pay the cost of publication of this article, through the GIFACT Research Group.
References
- AELDE Business School. Qué es un análisis financiero y para qué sirve en la empresa. AELDE Business School. Retrieved from: https://www.ealde.es/que-es-analisis-financiero/.(2020, June 30). (2022, April 20).
- Ali Balc?, M., Batrancea, L., Akgüller, Ö., Gabán, L., Rus, M.-I., & Tulai, H. Fractality of Borsa Istanbul during the COVID-19 Pandemic. Mathematics, 2022; 10(14), 2503. doi:https://doi.org/10.3390/math10142503. (2022, July 22). (2024, February 27).
CrossRef - Aldáz, G. (2021). La predicción de quiebra e insolvencia en las empresas florícolas de la Zona 3 de la República del Ecuador. Ambato, Ecuador: Universidad Técnica de Ambato. 2021. Retrieved from https://repositorio.uta.edu.ec/bitstream/123456789/32455/1/T4950ig.pdf (2024, February 27).???????
- Almeida, R. Análisis de supervivencia aplicado a las pequeñas y medianas empresas cosntructuras en Ecuador en el período 2012-2017. Quito: Universidad Andina Simón Bolívar. 2021.Retrieved from https://repositorio.uasb.edu.ec/bitstream/10644/8058/1/T3493-MGFARF-Almeida-An%C3%A1lisis.pdf. (2021, December 5).
- Banco Central del Ecuador. La economía Ecuatoriana decreció 12,4% en el segundo trimestre de 2020. Banco Central del Ecuador. Retrieved from: https://www.bce.fin.ec/index.php/boletines-de-prensa-archivo/item/1383-la-economia-ecuatoriana-decrecio-12-4-en-el-segundo-trimestre-de-2020 (2020, September 30). (2022, July 15).
- Bermeo, D., & Armijos, J. Predicción de quiebra bajo el modelo Z2 Altman en empresas de construcción de edificios residenciales de la provincia del Azuay. Revista Economía y Política, 2021; 33, 48-63. Retrieved from http://scielo.senescyt.gob.ec/scielo.php?pid=S2477-90752021000200048&script=sci_arttext. (2024, February 27).
CrossRef - Buele, I., Tigsi, A., & Solano, S. Análisis Financiero y Pronóstico de Fallas Empresariales Aplicado a to Manufacturing Compañías. Academy of Accounting and Financial Studies Journal, 2021; 25(2), 1-11. Retrieved from https://www.abacademies.org/articles/Financial-analysis-and-forecasting-of-business-failure-applied-to-manufacturing-companies-1528-2635-25-2-707.pdf. (2021, March, 1). (2022, January 10).
- Camino, S., Bermudez, N., Suarez, D., & Mendoza, C. Estudio Sectorial: Industria Manufacturera en el Ecuador Período 2013-2017. Quito: Superintendencia de Compañias, Valores y Seguros. 2018. Retrieved from https://investigacionyestudios.supercias.gob.ec/wp-content/uploads/2018/09/Panorama-de-la-Industria-Manufacturera-en-el-Ecuador-2013-2017.pdf. (2018). (2022, January 10).
- Carchi, K., Crespo, M., González, S., & Romero, E.. Indices financieroa, la clave de la fianza administrativa aplicada a una empresa manufacturera. INNOVA Research Journal. 2020;5(2), 26-50. doi:https://doi.org/10.33890/innova.v5.n2.2020.1193. (2020, August, 1). (2022, February 1).
CrossRef - Catucuamba, M., Torres, A., & Zambrano, K. Modelo Z de Altman. Contabilidad Financiera y Gerencial. 2018;1-8. Retrieved from https://www.academia.edu/38170470/PAPER_MODELO_Z. (2018, December 15). (2022, January 10).
- CEPAL. Sectores y empresas frente al COVID-19: emergencia y reactivación. 2020. Santiago de Chile: CEPAL. Retrieved from https://repositorio.cepal.org/bitstream/handle/11362/45734/4/S2000438_es.pdf. (2020, Julio 2). (2022, February 1).
- Charchi, K., Crespo, M., González, S., & Romero, E. Índices financieros, la clave de la finanza administrativa aplicada a una empresa manufacturera. INNOVA Research Journal. 2020; 5(2), 26-50. doi:https://doi.org/10.33890/innova.v5.n2.2020.1193. (2020, May 7). (2022, January 10).
CrossRef - De La Cruz, C. Business Intelligence para la toma de decisiones financieras en la corporación los portales Unidad vivienda - Magdalena.Lima: Universidad César Vallejo. 2017. Retrieved from https://repositorio.ucv.edu.pe/handle/20.500.12692/9926. (2017, January 1). (2022, February 1).
- De Llano, P., Piñero, C., & Rodríguez, M. Predicción del fracaso empresarial. Una contribución a la síntesis de una teoría mediante el análisis comparativo de distintas técnicas de predicción. Estudios de economía. 2016; 43(2), 163-198. doi:http://dx.doi.org/10.4067/S0718-52862016000200001. (2016, Decembre 1). (2022, January 10).
CrossRef - Defensoría del Pueblo de Ecuador. Defensoría del Pueblo de Ecuador. Retrieved from https://www.dpe.gob.ec/.(2020, June 1). (2022, January 10).
- Fernández, T. Análisis del desempeño financiero en un entorno de incertidumbre, en el sector manifacturero de la provincia de Cotopaxi. Ambato: Universidad Técnica de Ambato. (2020). Retrieved from https://repositorio.uta.edu.ec/bitstream/123456789/31429/1/T4810M.pdf. (2020, January 1). (2022, January 10).
- Gallardo, V., & Garrido, R. Aplicación de un modelo de predicción de quiebra a empresas del sector construcción de la ciudad de Chillán. Chillán: Universidad del Bio-Bio. (2016). Retrieved from http://repobib.ubiobio.cl/jspui/bitstream/123456789/1511/1/Gallardo%20Lagos%2C%20Victor.pdf. (2016, August 1). (2022, January 10).
- García, O. COVID-19: la nueva enfermedad X. Sanidad Militar. 2020; 76(1), 5-7. Retrieved from https://scielo.isciii.es/scielo.php?script=sci_arttext&pid=S1887-85712020000100001. (2020, January 1). (2022, January 10).
- Gnecco, M., Urrutia, M., Trani, M., & Iriberri, J. Aplicación de modelos de pronóstico de fracaso empresario a empresas con actividad en la cuidad de Mar del Plata. Uiversidad CAECE, Docente de Administración Financiera. 2020; 119. Retrieved from https://economicas.unsa.edu.ar/afinan/informacion_general/sadaf/xl_jornadas/40-j-gnecco-et-al-aplicacion-de-modelos-de-pronostico-de-fracaso-empresario.pdf. (2020, October 1). (2022, January 10).
- Gómez, S. & Leyva, G. Utilidad de los modelos de predicción de fracaso y su aplicabilidad en las cooperativas. Cofin Habana. 2019; 1-13. Retrieved from http://scielo.sld.cu/scielo.php?script=sci_arttext&pid=S2073-60612019000300013. (2019, July 1). (2022, January 10).
- Guzmán, R., Jaramillo, J., & Manguay, J. Modelo de Monitoreo de Quiebras de Empresas mediante la integración del Modelo de Altman Z-Score con la Metodología de Gráficos de Control en el sector textil CIIU C14. (2019). Quito: Universidad Central del Ecuador. Retrieved from http://www.dspace.uce.edu.ec/handle/25000/20122. (2020, January 1). (2022, January 10).
- Hernández, M. Modelo financiero para la detección de quiebras con el uso de análisis discriminante múltiple. InterSedes: Revista de las Sedes Regionales. 2014;4-19. Retrieved from https://www.scielo.sa.cr/pdf/is/v15n32/2215-2458-is-15-32-00004.pdf. (2014, June 5). (2022, January 10).
CrossRef - Horna, L., Guachamín, M., & Osorio, N. Análisis de mercado del sector industrias manufactureras en base a CIIU 3 bajo enfoque de concentración económica en el período 2000-2008 en el Ecuador. Revista Politécnica. 2009. 30(1), 230-243. Retrieved from https://bibdigital.epn.edu.ec/bitstream/15000/5543/1/Luis-Horna-4.pdf. (2020, January 1). (2022, January 10).
- Lavalle, A. Análisis Financiero. (2016). Tlalnepantla: UNID. Retrieved from https://books.google.com.ec/books/about/An%C3%A1lisis_financiero.html?id=RuE2DAAAQBAJ&redir_esc=y. (2016, May 23). (2022, April 10).
- Lodeiro, P. Academia de Inversión. Retrieved from Aprende a invertir en Bolsa: https://www.academiadeinversion.com/. (2013, September 10). (2022, January 10).
- Lucero, K. La manufactura, una tabla de salvación en medio de la crisis. Revista Gestión Digital. 2020;1. Retrieved from https://www.revistagestion.ec/economia-y-finanzas-analisis/la-manufactura-una-tabla-de-salvacion-en-medio-de-la-crisis. (2020, Agosto 26). (2022, April 10).
- Naula, F., Arévalo, D., Campoverde, J., & López, J. Estrés financiero en el sector muanufacturero de Ecuador. Revista Finanzas y Política Económica. 2020; 12(2), 46-490. Retrieved from http://www.scielo.org.co/pdf/fype/v12n2/2248-6046-fype-12-02-461.pdf. (2020, January 1). (2022, January 10).
CrossRef - Mera, E. Análisis de riesgo de quiebra del sector manufacturero ecuatoriano por medio de Z-Score de Altman en el periodo 2015-2019. 2021. Guayaquil-Ecuador: Escuela Politécnica Nacional. Retrieved from https://www.dspace.espol.edu.ec/bitstream/123456789/53479/1/T-111568%20MERA%20EMILIO.pdf. (2024, February 27).
- Morales, A., Avendaño, S., & Mata, J. Pronóstico de quiebra y valuación de acciones en empresas sustentables de México en la era COVID19. Económicas Cuc, 2021;42(2), 161-172. Retrieved from https://revistascientificas.cuc.edu.co/economicascuc/article/view/3133/3759 (2024, February 27).
CrossRef - Pierre, R., & Harris, P. COVID-19 en América Latina: Retos y oportunidades. Revista Chilena de Pediatría. 2020; 91(2), 179-182. doi:http://dx.doi.org/10.32641/rchped.vi91i2.2157. (2020, April 1). (2022, April 10).
CrossRef - Puerta, F., Vergara, J., & Huertas, N. Análisis financiero enfoques en su evolución. Criterio Libre. 2018; 16(28), 75-94. Retrieved from https://dialnet.unirioja.es/servlet/articulo?codigo=6676021. (2018, April 05). (2022, January 10).
CrossRef - Rivera, O.. Estimación del Riesgo de Quiebre en Épocas de Crisis Aplicación del Modelo Altman "Z Score". AIC. 2021;1. Retrieved from http://contadores-aic.org/estimacion-del-riesgo-de-quiebra-en-epocas-de-crisis-aplicacion-del-modelo-altman-z-score-2/. (2021, January, 1). (2022, January 10).
- Salazar, N., & Silva, A. ¿El modelo de Z-Score de Altman permite prever el estado de quiebra en las Pymes?. (2019). Bogotá: Corporación Universitaria Minuto de Dios. Retrieved from https://repository.uniminuto.edu/jspui/bitstream/10656/9873/1/Salazar%20Nayeth_Silva%20Angie_2019.pdf. (2019, November 1). (2022, April 10).
- Santiago, F., & Vargas, F. BID. Retrieved from Problemas en la fábrica (II): ¿Cómo reactivar la manufactura en tiempos de COVID-19?: https://blogs.iadb.org/innovacion/es/reactivar-la-manufactura-en-tiempos-de-covid-19/. (2020, June 23). (2022, April 10).
- Secretaría Técnica Planifica Ecuador. Evaluación Socioeconómica PDNA Covid-19 Ecuador Marzo-Mayo, 2020. 2020. Quito: Secretaría Técnica Planifica Ecuador. Retrieved from https://sni.gob.ec/documents/10180/4534845/Informe+Evaluaci%C3%B3n+Socio+Economica_PDNA.pdf/bf1ff6a4-4a67-4f5f-abab-5512f821d270. (2020, January 23). (2022, April 10).
- Tascón, M., & Castaño, F. Variables y Modelos Para La Identificación y Predicción Del Fracaso Empresarial: Revisión de La Investigación Empírica Reciente. Revista de Contabilidad. 2012; 15(1), 7-58. Retrieved from https://www.sciencedirect.com/science/article/pii/S1138489112700377(2012, January 01). (2022, April 10).
CrossRef - Tejada, S., Luque, A., & Taipe, J. Plan de inversión para la fabricación de paletas vitamínicas para niños: el caso de la provincia de Cotopaxi. Revista de Planeación y Control Microfinanciero. 2017; 3(10), 1-15. Retrieved from https://www.ecorfan.org/spain/ researchjournals/ Planeacion_y_ Control_Microfinanciero/ vol3num10/Revista_de_ Planeaci% C3%B3n_y_ Control_Microfinanciero_V3_N10.pdf.
- Universidad Técnica Particular de Loja. UTPL. Retrieved from COVID-19 en Ecuador: potenciales impactos en la pobreza: https://noticias.utpl.edu.ec/covid-19-en-ecuador-potenciales-impactos-en-la-pobreza. (2020, May 1). (2022, April 10).
- Van, J. C., & Wachowicz, J. M. Fundamentos de Administración Financiera (Décimotercera ed.). 2010. México: PEARSON. Retrieved from https://catedrafinancierags.files.wordpress.com/2014/09/fundamentos-de-administracion-financiera-13-van-horne.pdf. (2010, January 1). (2022, April 10).

This work is licensed under a Creative Commons Attribution 4.0 International License.